Timeline
Your performance over time is illustrated by online tools. In the project management section, you can visualize your planning with the Gantt chart.
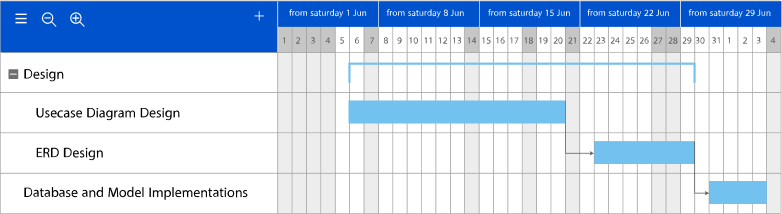
Gantt Chart
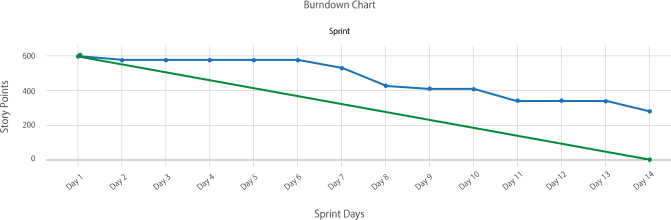
Burndown Chart
In the Scrum product, Burndown chart gives you a comprehensive view of the latest status of the completed and remaining tasks, as well as the velocity.